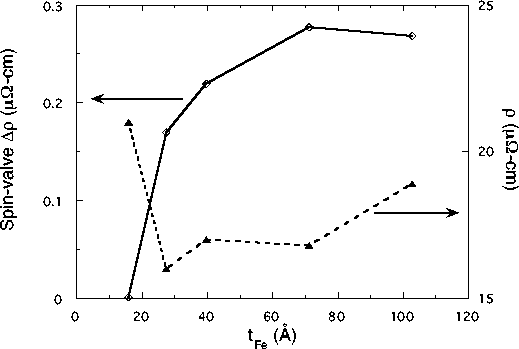
Figure 3: Spin-valve Dr and r values versus Fe thickness for the samples whose Dr/r is shown in Figure 2. The thickness variation of the MR is clearly dominated by the change in Dr, the numerator of the expression, although the increase in r for low Fe (or Co) thicknesses also plays a role.