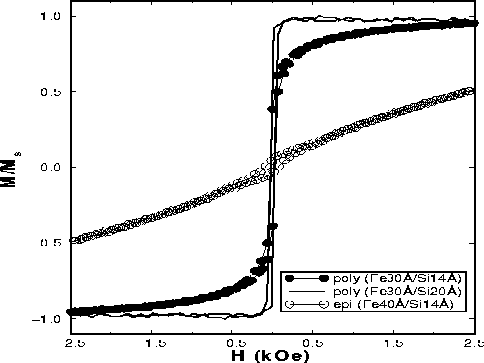
Magnetization curves for three Fe/Si multilayers. The y-axis shows magnetization data normalized to the saturated value. The solid line indicates data for a polycrystalline (Fe30Å/Si20Å)x50 multilayer which has a magnetization curve much like bulk Fe. The open circles indicate data for an epitaxial (Fe40Å/Si14Å)x40 multilayer which has the high saturation field and low remanent magnetization that are characteristic of antiferromagnetic interlayer exchange coupling. The polycrystalline (Fe30Å/Si14Å)x50 multilayer (indicated by filled circles) has weaker antiferromagnetic coupling than the epitaxial multilayer.